The VanEck Junior Gold Miners ETF (NYSE:GDXJ) is an exchange-traded fund (ETF) consisting of mostly medium to smallish precious metals companies. For investors looking to diversify broadly in that sector, it’s quite interesting.
Some of the components include Yamana Gold Inc. (NYSE:AUY) with 5.97% of the fund, Kinross Gold Corp. (NYSE:KGC) with 5.74% and Pan American Silver Corp. (NYSE:PAAS) with 4.57% – he best known of the miners represented.
Among the lesser-known names are smaller outfits such as Endeavour Mining PLC (OTC:EDVMF) with 4.05%, B2Gold Corp. (NYSE:BTG) with 3.95% and Alamos Gold Inc. (NYSE:AGI) with 3.54%.
As of Sept. 7, the fund held 100 positions with most of the rest of the components representing small and very small operations, all of which are publicly traded.
The idea here is that investors gain broad ownership of many different medium and small mining operations so that diversification beyond the huge miners – Newmont Corp. (NYSE:NEM) and Barrick Gold Corp. (NYSE:GOLD), for example – is achieved.
See also: How to Invest in Gold in 2022
For investors concerned with the possibility of increased inflation, it’s a fascinating concept. Here’s the daily price chart:
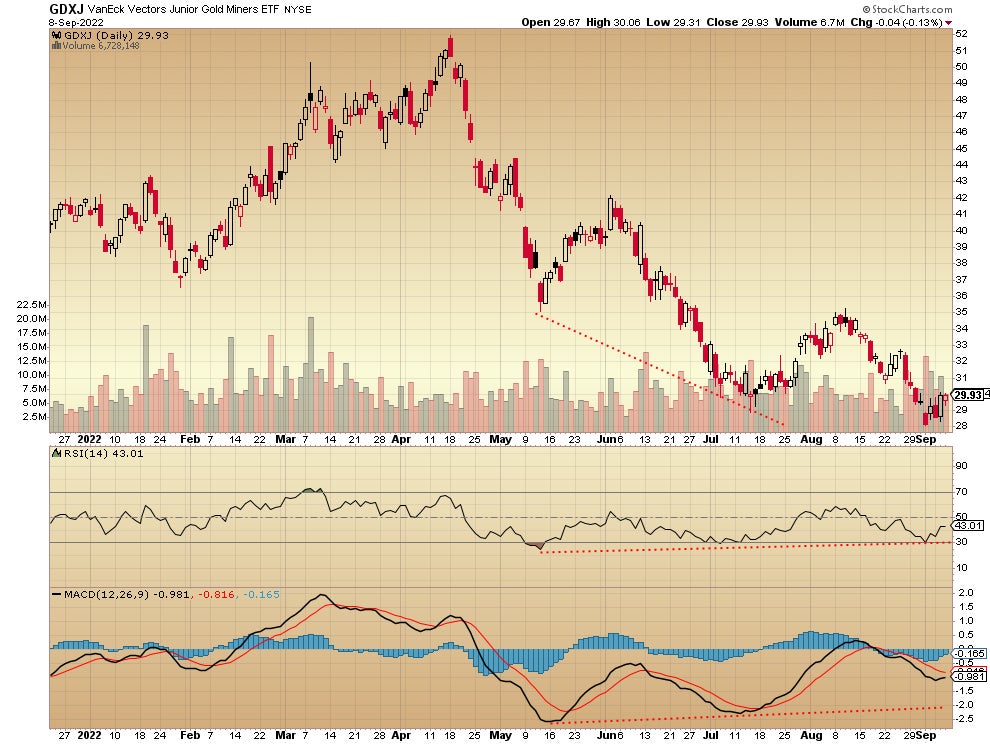
Note the positive divergences appearing on the relative strength indicator (RSI) and on the moving average convergence/divergence indicator (MACD), both below the price chart. There is less downward pressure each time this fund hits a new low, which is the significance of the divergences. This kind of look can mean that selling is drying up and giving way to buying.
Here’s the daily price chart for the largest holding, Yamana Gold:
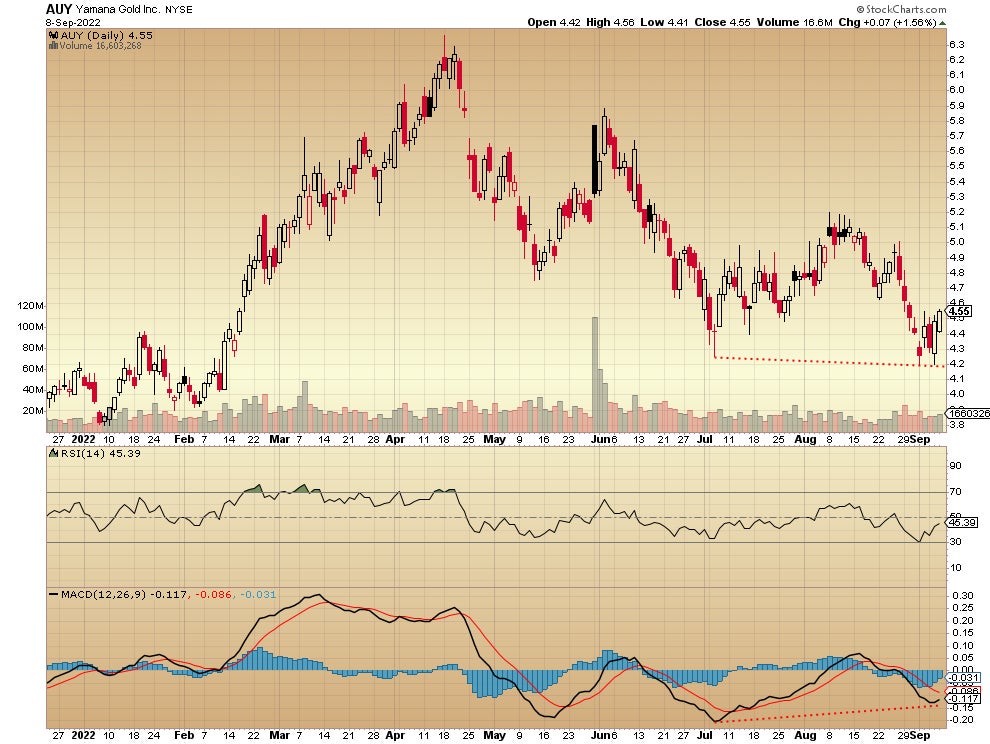
Notice how the MACD is trending higher as the September low barely takes out the early July low. The RSI is not showing it yet, but it may be early for this position. Note that the early January 2022 are holding thus far.
This is the daily price chart for the second-largest holding, Kinross Gold:
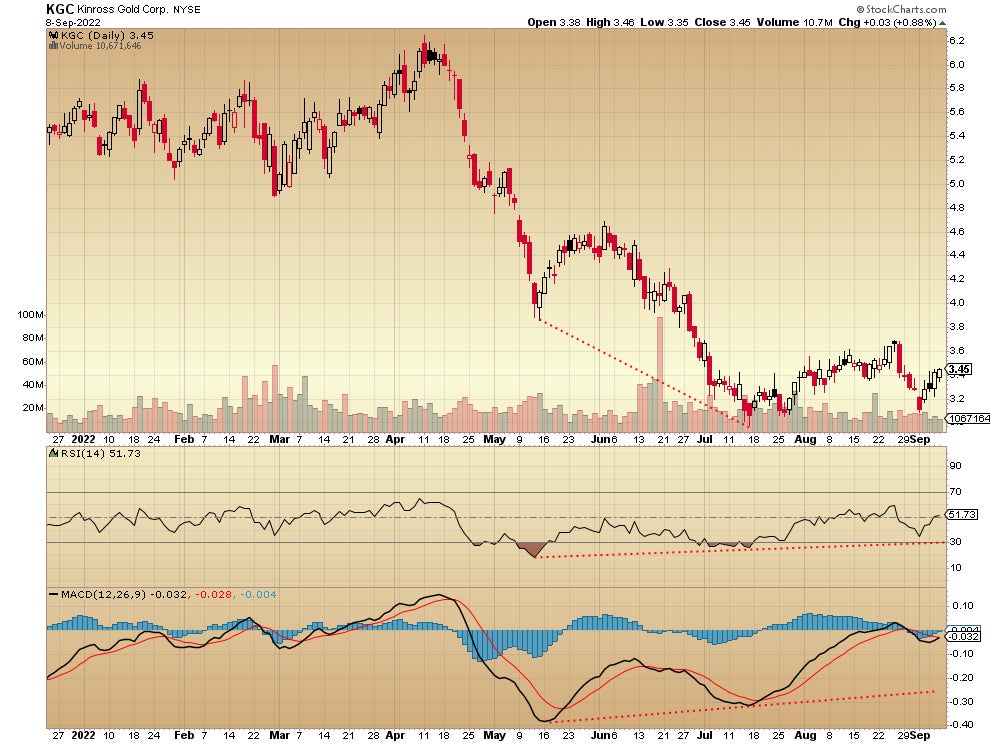
This is a clear example of the steadily rising RSI and MACD indicators showing positive divergences to the price action. Note that the September low remains (so far) above the mid-July low. Kinross is adding a 3.48% dividend to the fund as a bonus.
And here’s the price chart for the third-largest component, Pan American Silver:
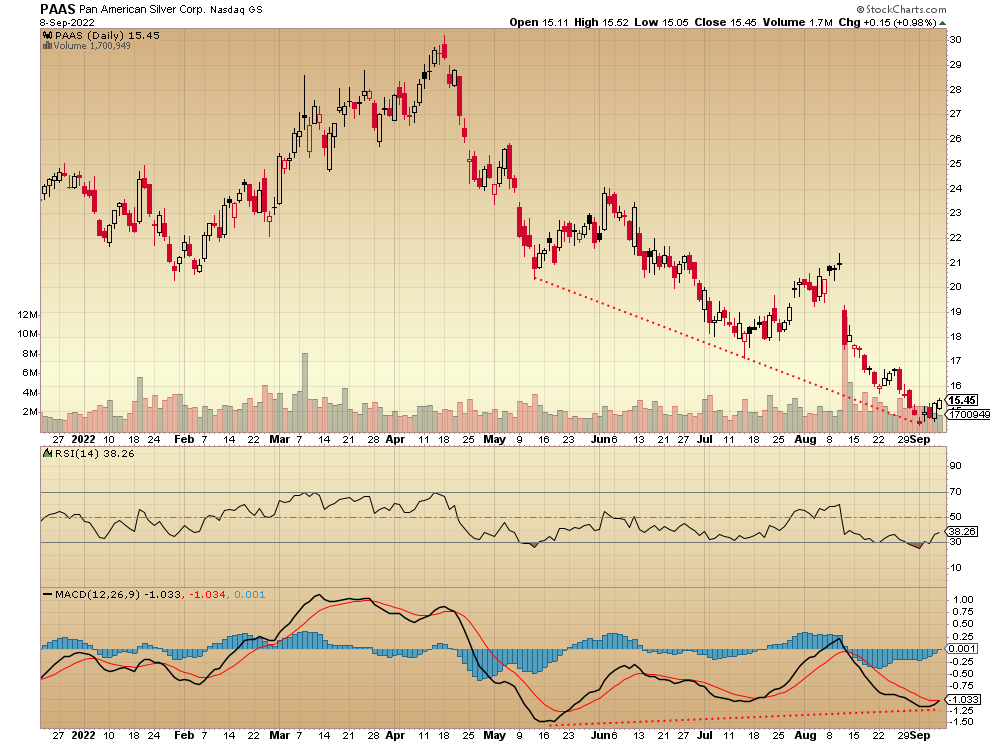
This one adds excellent exposure to the silver mining market. The look here is more dramatic with the fall from the April high to the recent low. Nonetheless, the moving average convergence/divergence indicator is suggesting a slowing of selling momentum. The RSI doesn’t yet agree.
For diversification into medium to smaller miners, as a hedge for fear of greater inflation, VanEck may be worth a look.
Related: How Much is a Gold Bar Worth?
Not investment advice. For educational purposes only.
Charts courtesy of StockCharts