Marriott Intl (NASDAQ:MAR) has observed the following analyst ratings within the last quarter:
| Bullish | Somewhat Bullish | Indifferent | Somewhat Bearish | Bearish | |
|---|---|---|---|---|---|
| Total Ratings | 0 | 2 | 5 | 0 | 0 |
| Last 30D | 0 | 0 | 1 | 0 | 0 |
| 1M Ago | 0 | 1 | 1 | 0 | 0 |
| 2M Ago | 0 | 1 | 2 | 0 | 0 |
| 3M Ago | 0 | 0 | 1 | 0 | 0 |
These 7 analysts have an average price target of $175.29 versus the current price of Marriott Intl at $163.66, implying upside.
Below is a summary of how these 7 analysts rated Marriott Intl over the past 3 months. The greater the number of bullish ratings, the more positive analysts are on the stock and the greater the number of bearish ratings, the more negative analysts are on the stock
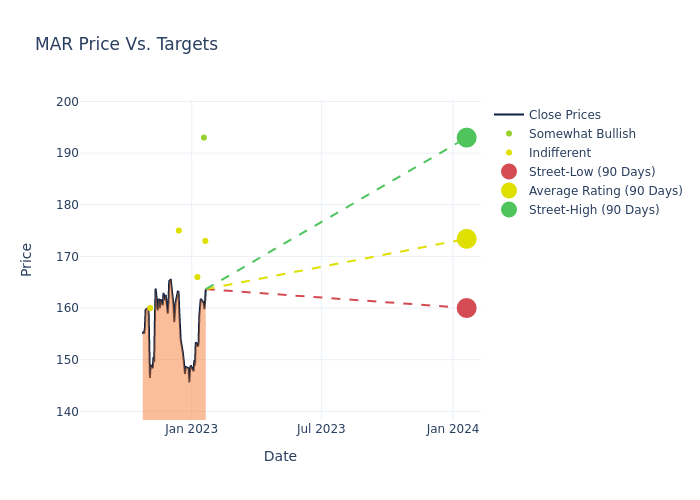
This current average has increased by 2.15% from the previous average price target of $171.60.
Stay up to date on Marriott Intl analyst ratings.
What Are Analyst Ratings?
Ratings come from analysts, or specialists within banking and financial systems that report for specific stocks or defined sectors (typically once per quarter for each stock). Analysts usually derive their information from company conference calls and meetings, financial statements, and conversations with important insiders to reach their decisions.
Some analysts publish their predictions for metrics such as growth estimates, earnings, and revenue to provide additional guidance with their ratings. When using analyst ratings, it is important to keep in mind that stock and sector analysts are also human and are only offering their opinions to investors.
This article was generated by Benzinga’s automated content engine and reviewed by an editor.