
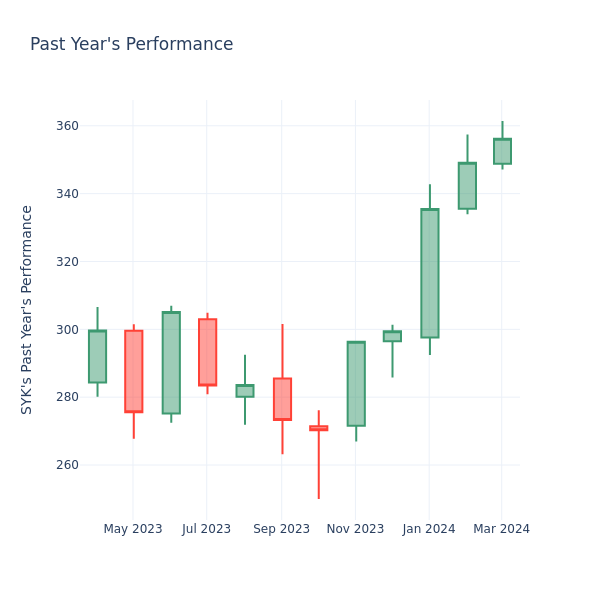
In the current session, the stock is trading at $351.79, after a 0.63% spike. Over the past month, Stryker Inc. (NYSE:SYK) stock increased by 1.24%, and in the past year, by 26.87%. With performance like this, long-term shareholders are optimistic but others are more likely to look into the price-to-earnings ratio to see if the stock might be overvalued.
How Does Stryker P/E Compare to Other Companies?
The P/E ratio is used by long-term shareholders to assess the company’s market performance against aggregate market data, historical earnings, and the industry at large. A lower P/E could indicate that shareholders do not expect the stock to perform better in the future or it could mean that the company is undervalued.
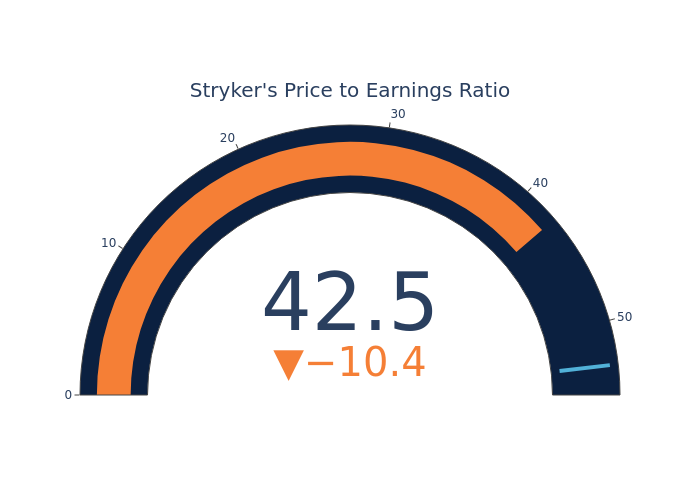
Compared to the aggregate P/E ratio of the 52.9 in the Health Care Equipment & Supplies industry, Stryker Inc. has a lower P/E ratio of 42.47. Shareholders might be inclined to think that the stock might perform worse than it’s industry peers. It’s also possible that the stock is undervalued.
In summary, while the price-to-earnings ratio is a valuable tool for investors to evaluate a company’s market performance, it should be used with caution. A low P/E ratio can be an indication of undervaluation, but it can also suggest weak growth prospects or financial instability. Moreover, the P/E ratio is just one of many metrics that investors should consider when making investment decisions, and it should be evaluated alongside other financial ratios, industry trends, and qualitative factors. By taking a comprehensive approach to analyzing a company’s financial health, investors can make well-informed decisions that are more likely to lead to successful outcomes.