
Microsoft Corporation (NASDAQ:MSFT) opened lower on Thursday ahead of key U.S. jobs data expected Friday.
The move came in tandem with the S&P 500, which was trading down about one quarter of a percent.
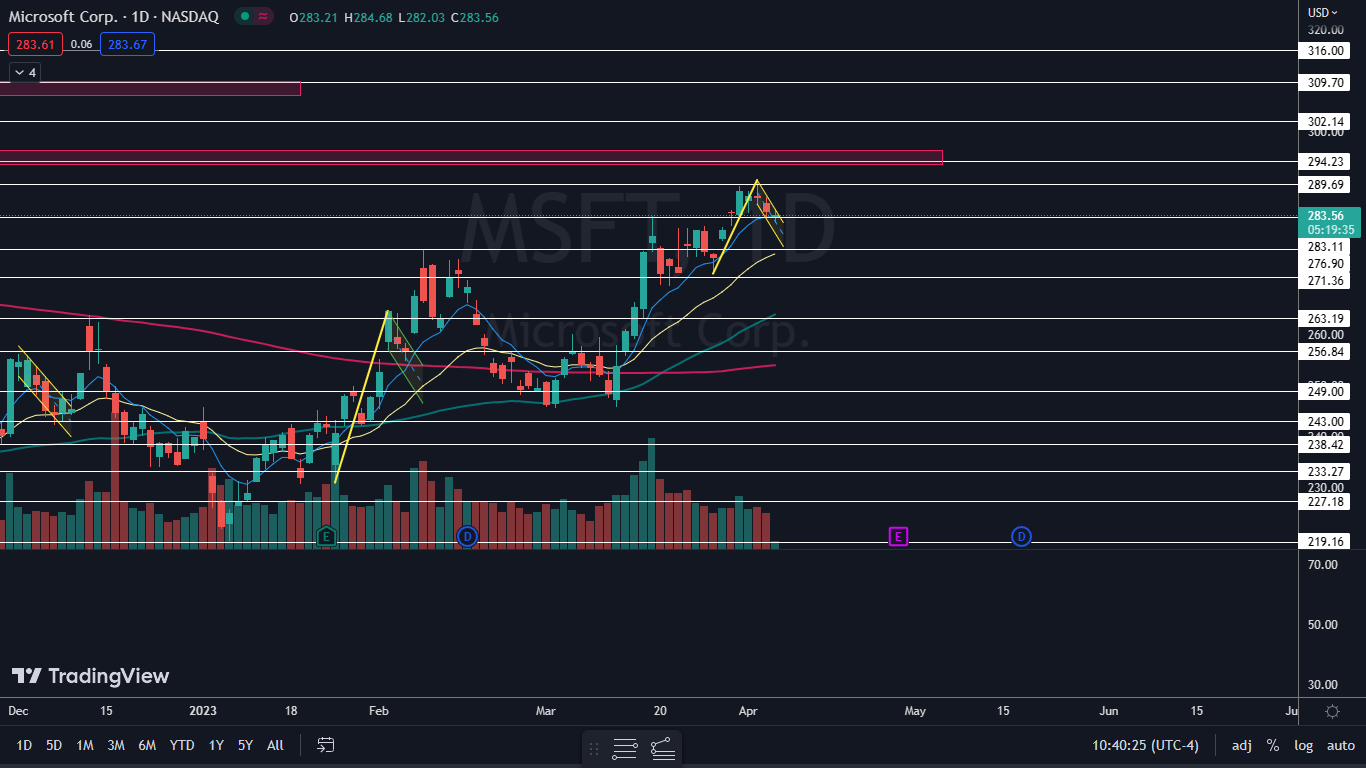
The tech giant has slid about 1% over the last two trading days on declining volume, which suggests a period of consolidation. The consolidation, after a 7% surge between March 28 and Tuesday, has Microsoft forming a possible bull flag pattern.
The bull flag pattern is created with a sharp rise higher forming the pole, which is then followed by a consolidation pattern that brings the stock lower between a channel with parallel lines or into a tightening triangle pattern.
- For bearish traders, the “trend is your friend” (until it’s not) and the stock may continue downwards within the following channel for a short period of time. Aggressive traders may decide to short the stock at the upper trendline and exit the trade at the lower trendline.
- Bullish traders will want to watch for a break up from the upper descending trendline of the flag formation, on high volume, for an entry. When a stock breaks up from a bull flag pattern, the measured move higher is equal to the length of the pole and should be added to the lowest price within the flag.
A bull flag is negated when a stock closes a trading day below the lower trendline of the flag pattern or if the flag falls more than 50% down the length of the pole.
Want direct analysis? Find me in the BZ Pro lounge! Click here for a free trial.
The Microsoft Chart: The measured move of Microsoft’s bull flag formation is about 7%, which suggests the stock could rise toward about $301 on a break of the pattern. Traders can watch for the stock to eventually break up above the upper descending trendline of the flag on higher-than-average volume to gauge whether the bull flag was recognized.
- If Microsoft breaks up from the bull flag pattern, the stock will fill an upper gap that exists between about $293 and $296. If that happens, Microsoft may find at least temporary resistance at the upper range of the gap.
- If Microsoft breaks down under the eight-day exponential moving average (EMA), the bull flag will be negated and traders can watch for a different pattern to eventually develop. If Microsoft loses support at the eight-day EMA, the stock may find support at the 21-day EMA.
- On Thursday, Microsoft was working to print a doji candlestick on the daily chart, which could indicate the local low has occurred and a rebound is in the cards for Monday. The stock is trading in an uptrend, which is likely to continue unless Microsoft falls under the $272 mark or forms a lower high over the next few days.
- Microsoft has resistance above at $289.69 and $294.23 and support below at $283.11 and $276.90.
 Read Next: Top Stories Thursday, Apr. 06: Biden Admin Finalizes Rule To Crack Down Deceptive Medicare Advantage Advertising, Weekly Jobless Claims Higher Than Expected, US Big Techs Face Difficulty Downsizing In Europe