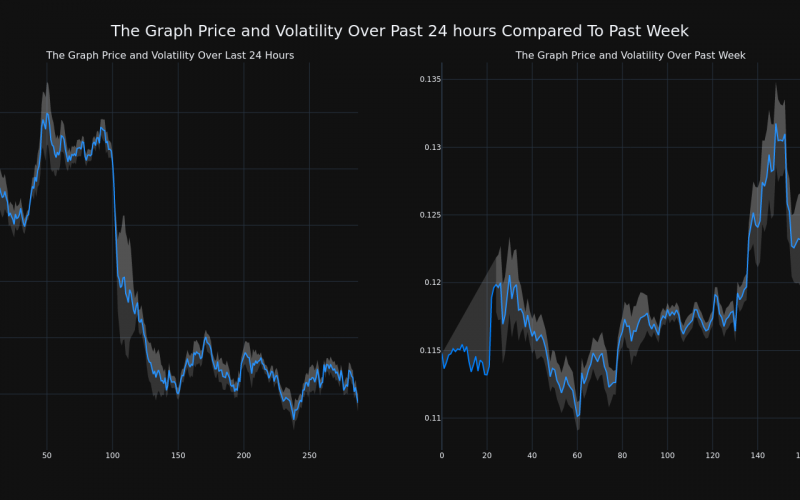
The Graph’s (CRYPTO: GRT) price has decreased 4.94% over the past 24 hours to $0.12. This is contrary to the coins performance over the past week where it has experienced an up-trend of 7.0%, moving from $0.11 to its current price.
The chart below compares the price movement and volatility for The Graph over the past 24 hours (left) to its price movement over the past week (right). The gray bands are Bollinger Bands, measuring the volatility for both the daily and weekly price movements. The wider the bands are, or the larger the gray area is at any given moment, the larger the volatility.

The trading volume for the coin has climbed 67.0% over the past week, moving opposite, directionally, with the overall circulating supply of the coin, which has decreased 0.32%. This brings the circulating supply to 8.96 billion. According to our data, the current market cap ranking for GRT is #43 at $1.09 billion.

Powered by CoinGecko API
This article was generated by Benzinga’s automated content engine and reviewed by an editor.