Advanced Micro Devices, Inc (NASDAQ:AMD) was falling lower Thursday, in tandem with the general market, which was continuing to suffer a bearish reaction to the Federal Reserve’s hawkish statement Wednesday.
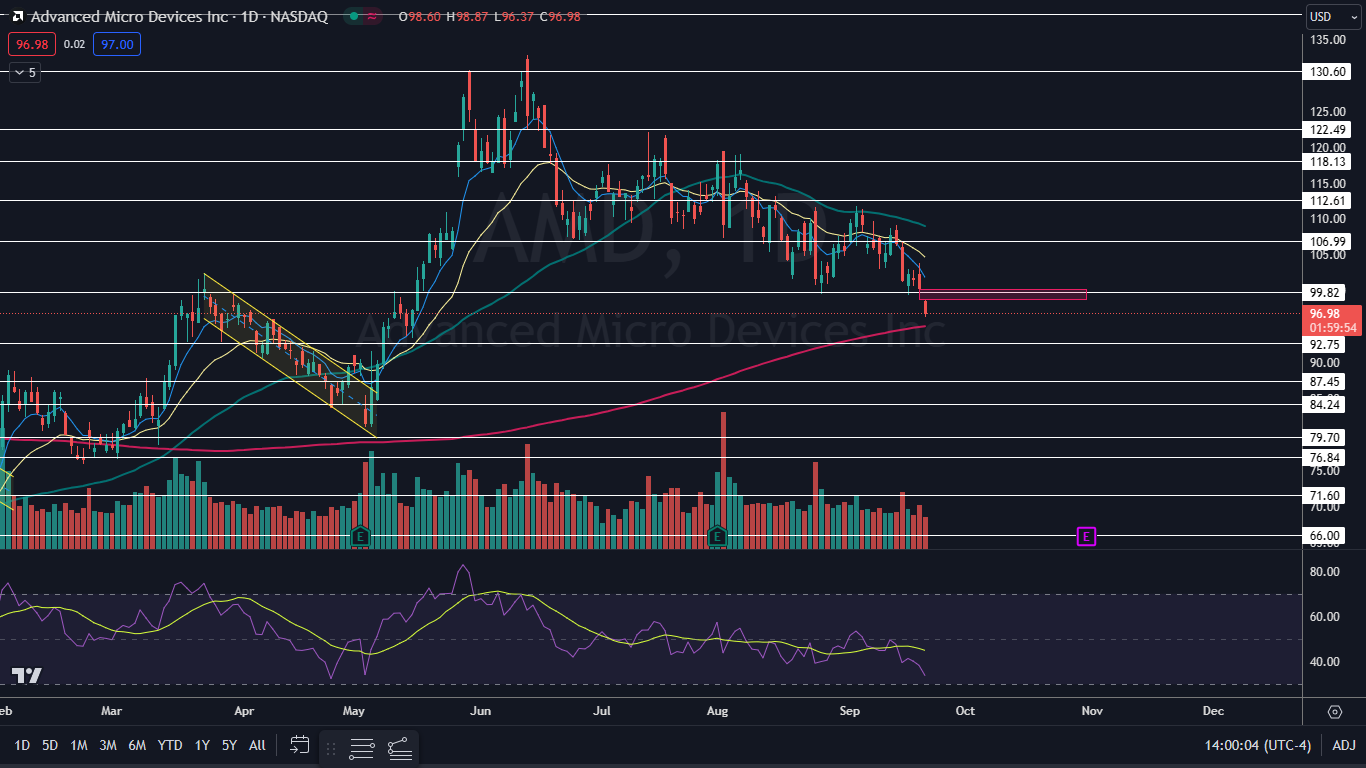
The chipmaker has been trading in a downtrend since June 13, making a series of lower highs and lower lows. On Thursday, the stock was working its way toward the 200-day simple moving average (SMA) within that trend.
The 200-day SMA is an important bellwether. Technical traders and investors consider a stock trading above the level on the daily chart to be in a bull cycle, whereas a stock trading under the 200-day SMA is considered to be in a bear cycle.
The 50-day SMA also plays an important role in technical analysis, especially when paired with the 200-day. When the 50-day SMA crosses below the 200-day SMA, a death cross occurs. When the 50-day SMA crosses above the 200-day, a bullish golden cross takes place.
Want direct analysis? Find me in the BZ Pro lounge! Click here for a free trial.
The AMD Chart: Although AMD is trading slightly above the 200-day SMA, the stock’s strong downtrend suggests AMD could drop below the area if the bearish pressure continues. In the meantime, the 200-day SMA is likely to act as support for at least a short period of time.
- Thursday’s move lower was taking place on lower-than-average volume, which indicates the stock could be running out of sellers. If AMD reaches the 200-day SMA, the stock is likely to consolidate above the area for a period of time on decreasing volume before it’s decided whether AMD will rebound or drop into a bear cycle.
- The stock was working to print a bearish kicker candlestick on Thursday, indicating lower prices may come on Friday. The small gap above, which exists between $98.87 and $100.28, may act as resistance on the next bounce.
- AMD has resistance above at $99.82 and $106.99 and support below at $92.75 and $87.45.
 Read Next: AI Bubble Or Revolution? Goldman Sachs Research Takes A Look
Photo via Shutterstock.