
The effects of rising interest rates continue to hit markets and none more so than in the mortgage sector. The amount of selling lately, for example, in Annaly Capital Management Inc. (NYSE:NLY) is remarkable for its extraordinary downward pressure on price levels.
Here’s the daily price chart, to show you how extreme this is:
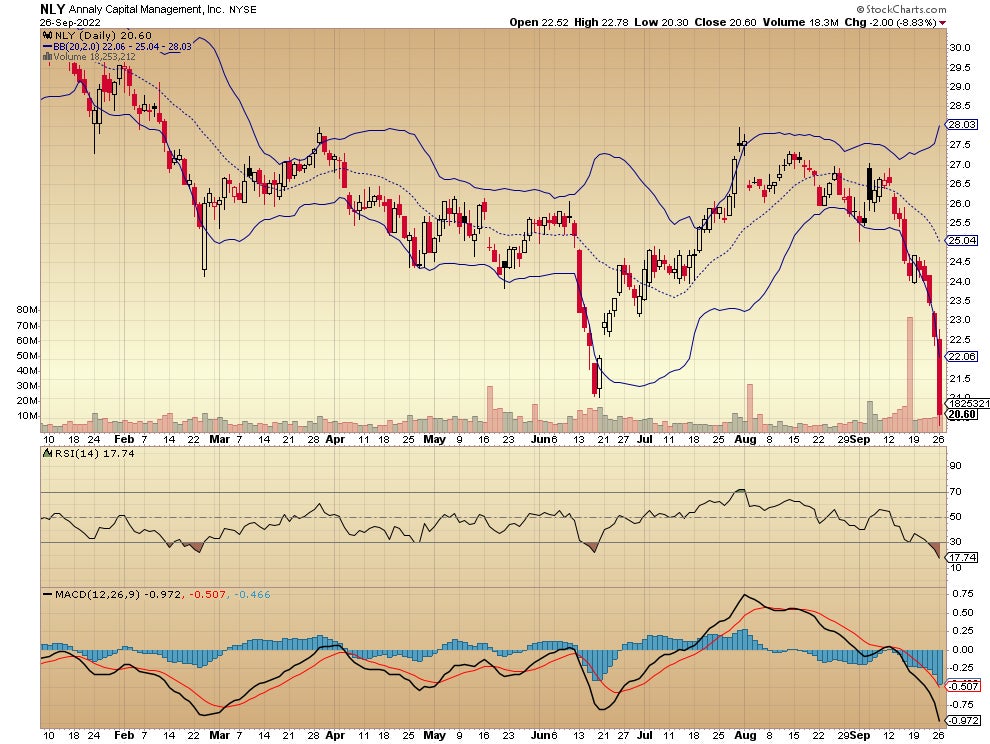
The upper and lower bands represent two standard deviations from the mean price — the mean is the dotted line in between them. Technical analyst John Bollinger popularized this form of examination when he appeared regularly on CNBC in the 1990s and later. Since then, this type of analysis has become known as Bollinger Bands.
Most of the time, prices tend to remain inside these two-standard deviation levels. Once in a while, when they poke through either the upper line or the lower line, it gets the attention of price chart analysts who proclaim the overbought or oversold status.
That the Annaly Capital Management Inc. chart for Sept. 26 shows a three-standard deviation from the mean reading — a rare event suggesting something special is taking place in the company’s mortgage real estate investment trust (REIT) business.
Indeed, that’s the case as the 30-year Treasury bond yield is hitting higher levels than seen for about 20 years — and as 30-year fixed rate mortgage yields follow the lead to higher and higher levels.
This is the effect of the higher Federal Reserve funds rate just established by the economists on the Federal Open Markets Committee. These much higher rates for mortgages will put a halt to the growth seen over recent years in real estate, construction and associated industries.
Don’t miss: This Little Known REIT Has Produced Double-Digit Annual Returns For The Past Five Years
For a longer-term perspective, here is Annaly Capital Management Inc.’s weekly price chart:
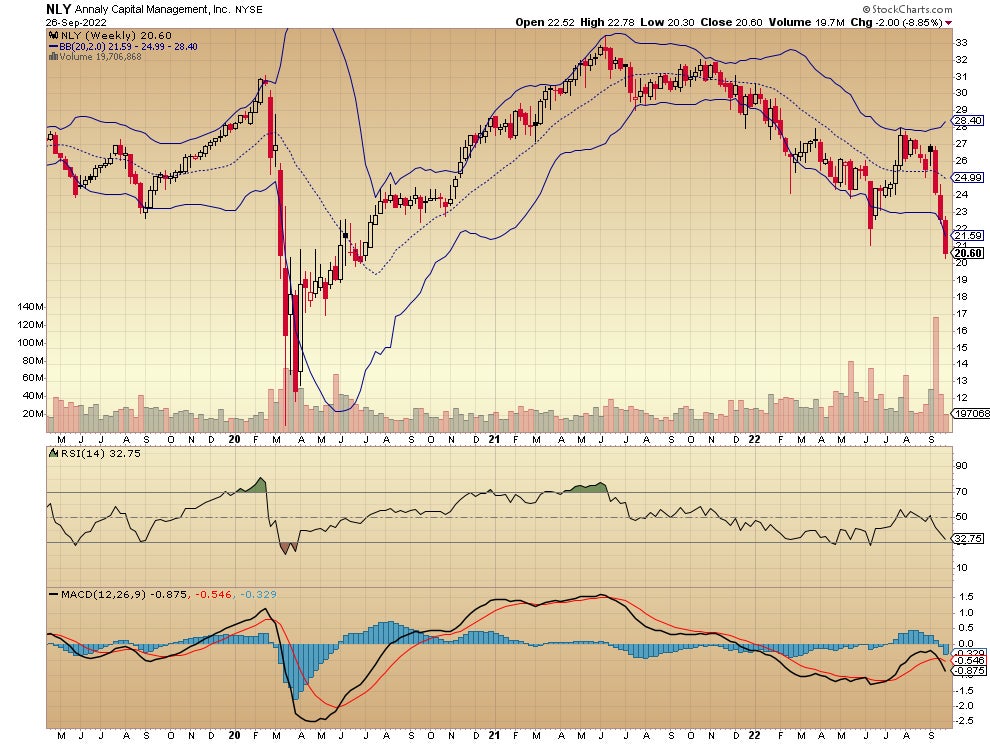
The drop below the lower Bollinger Band has happened only twice in the past two years — earlier this year in June and in March and April 2020 during the pandemic price plunge. Note that significant rallies eventually followed the below-the-band signature, but there are no guarantees of this.
It’s possible that prices may continue to fall for weeks or months despite what these charts seem to suggest.
Here’s the monthly price chart for Annaly Capital Management Inc.:
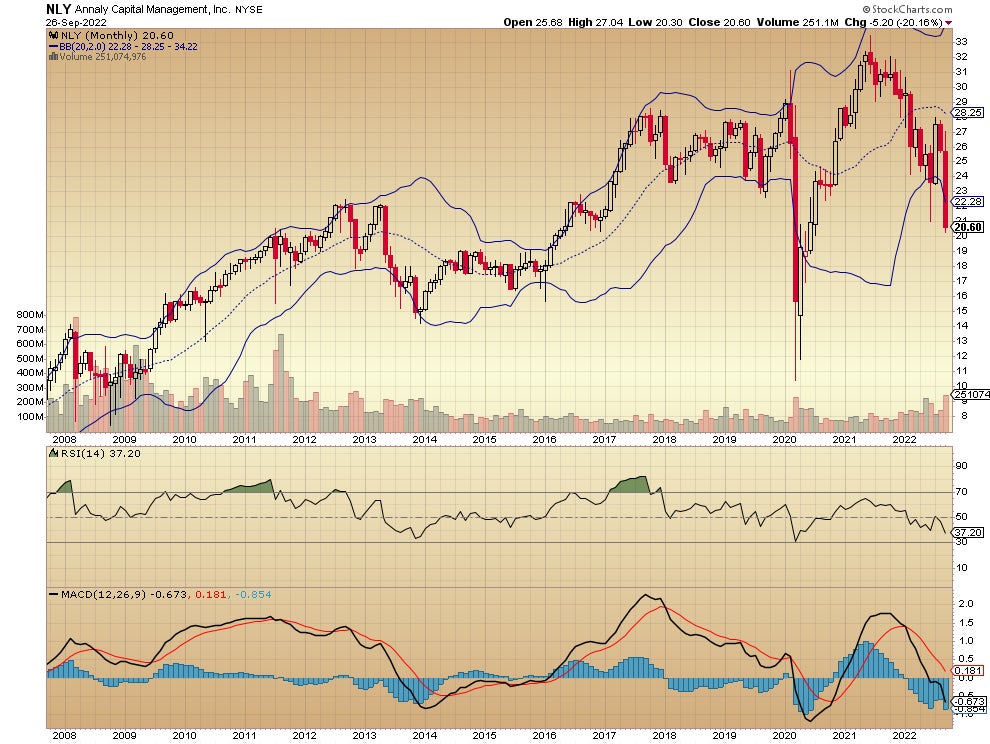
Look at how unusual it is for the price to close below that lower Bollinger Band when examined in this time frame. That such a rarity is unfolding this month for Annaly Capital — and with similar charts for other mortgage REITs — is a testament to the power of the Fed’s interest rate decisions.
Latest Private Market Real Estate Offerings
- New Farmland Investment Offering For 390-Acre Forage Crop Farm In Idaho
- Royce At Trumbull Multifamily Investment Offering Now Open For Pledging On RealtyMogul
Not investment advice. For educational purposes only.
Charts: Courtesy of StockCharts